dat %>% ggplot()
dat %>% ggplot() + geom_point(aes(x = cty, y = hwy, color = cyl_color), alpha = 0.7, size = 2)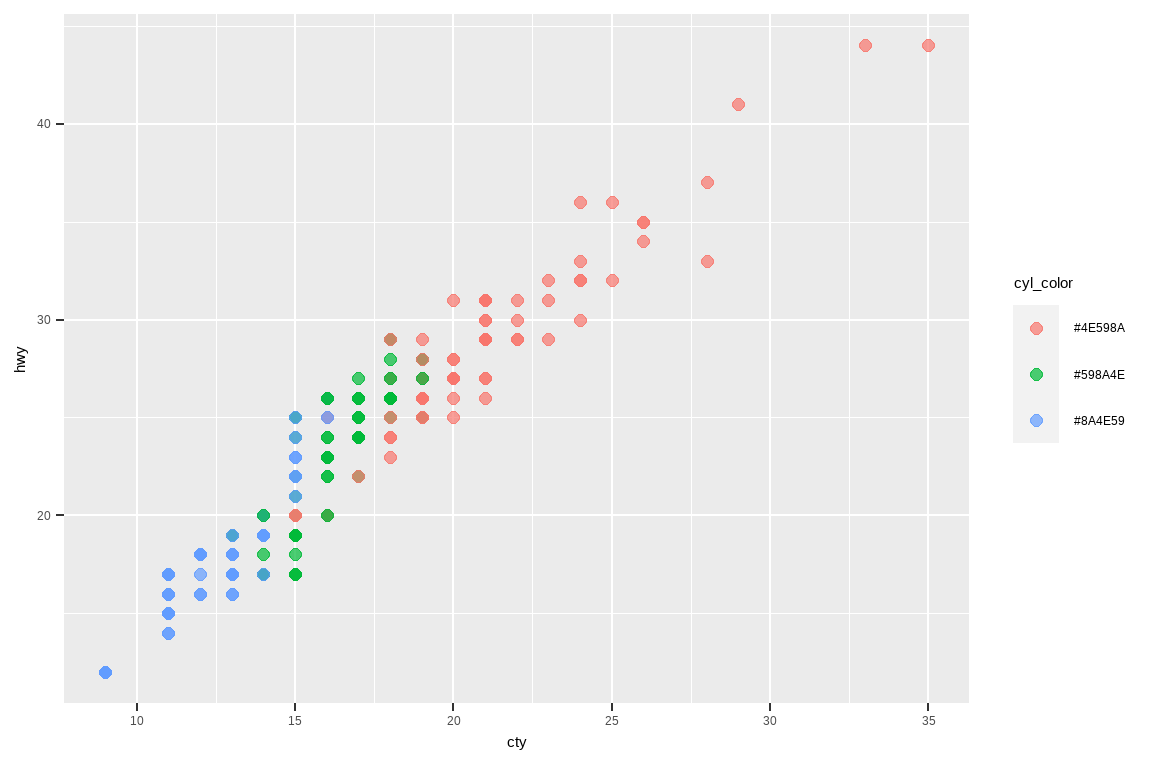
dat %>% ggplot() + geom_point(aes(x = cty, y = hwy, color = cyl_color), alpha = 0.7, size = 2) + scale_color_identity()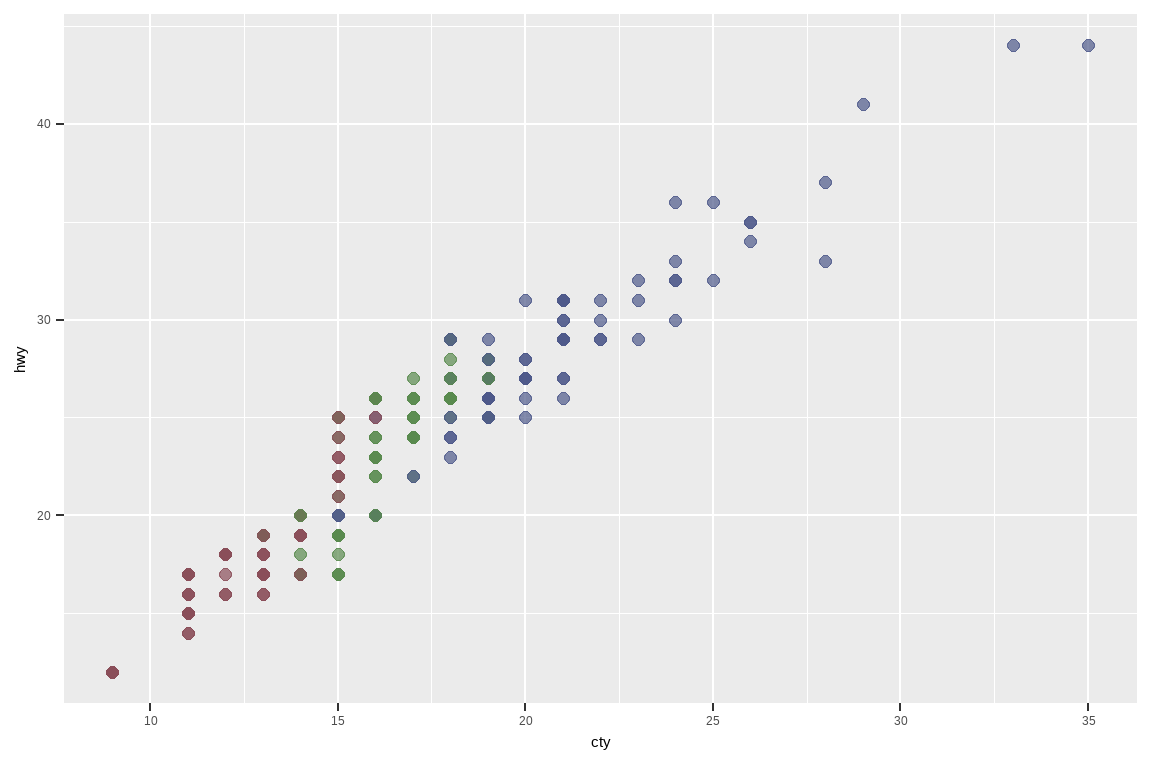
dat %>% ggplot() + geom_point(aes(x = cty, y = hwy, color = cyl_color), alpha = 0.7, size = 2) + scale_color_identity() + facet_wrap(~ cyl_text)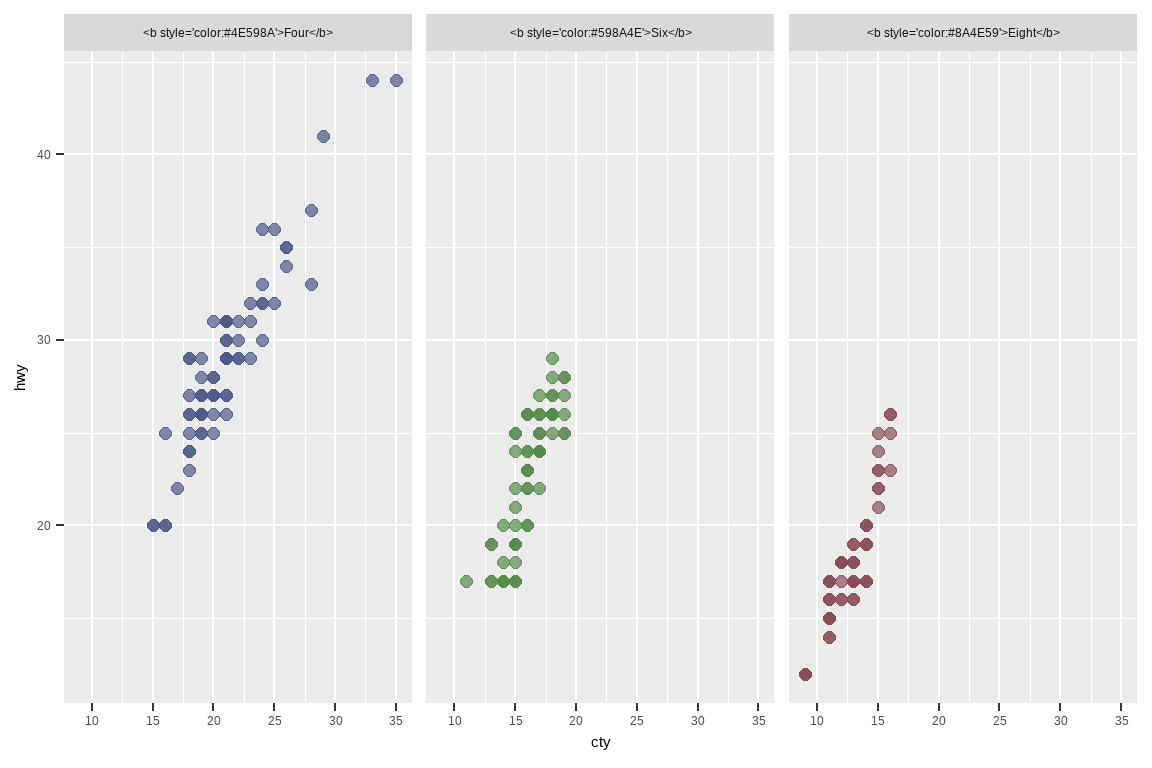
dat %>% ggplot() + geom_point(aes(x = cty, y = hwy, color = cyl_color), alpha = 0.7, size = 2) + scale_color_identity() + facet_wrap(~ cyl_text) + labs( title = title, subtitle = subtitle, x = 'City MPG', y = 'Highway\nMPG', caption = caption )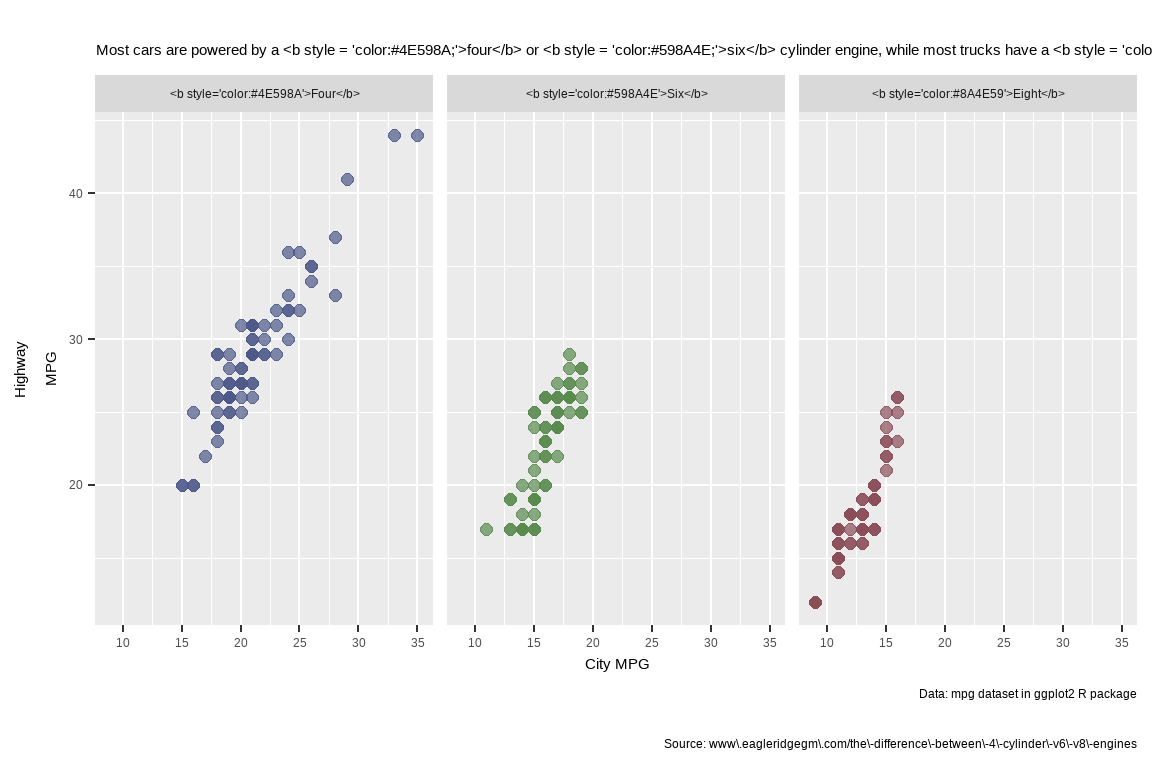
dat %>% ggplot() + geom_point(aes(x = cty, y = hwy, color = cyl_color), alpha = 0.7, size = 2) + scale_color_identity() + facet_wrap(~ cyl_text) + labs( title = title, subtitle = subtitle, x = 'City MPG', y = 'Highway\nMPG', caption = caption ) + theme_minimal()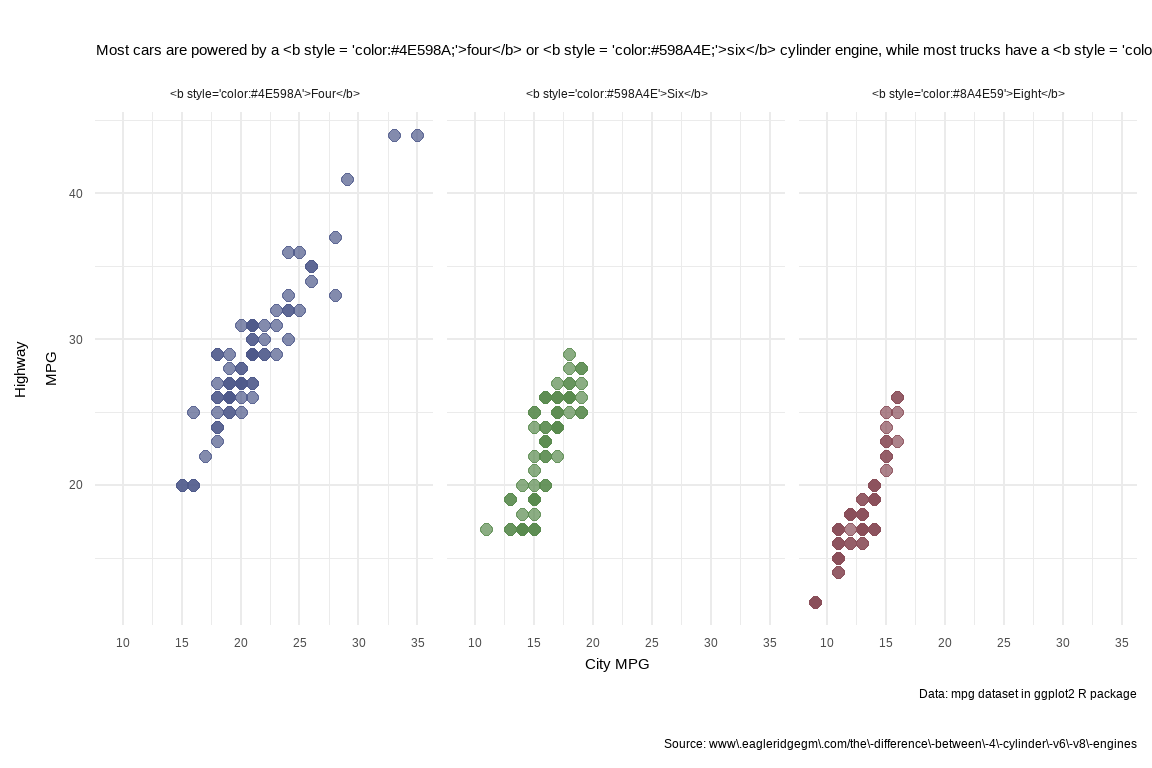
dat %>% ggplot() + geom_point(aes(x = cty, y = hwy, color = cyl_color), alpha = 0.7, size = 2) + scale_color_identity() + facet_wrap(~ cyl_text) + labs( title = title, subtitle = subtitle, x = 'City MPG', y = 'Highway\nMPG', caption = caption ) + theme_minimal() + theme(legend.position = 'none')
dat %>% ggplot() + geom_point(aes(x = cty, y = hwy, color = cyl_color), alpha = 0.7, size = 2) + scale_color_identity() + facet_wrap(~ cyl_text) + labs( title = title, subtitle = subtitle, x = 'City MPG', y = 'Highway\nMPG', caption = caption ) + theme_minimal() + theme(legend.position = 'none') + theme(text = element_text(family = 'Fira Code'))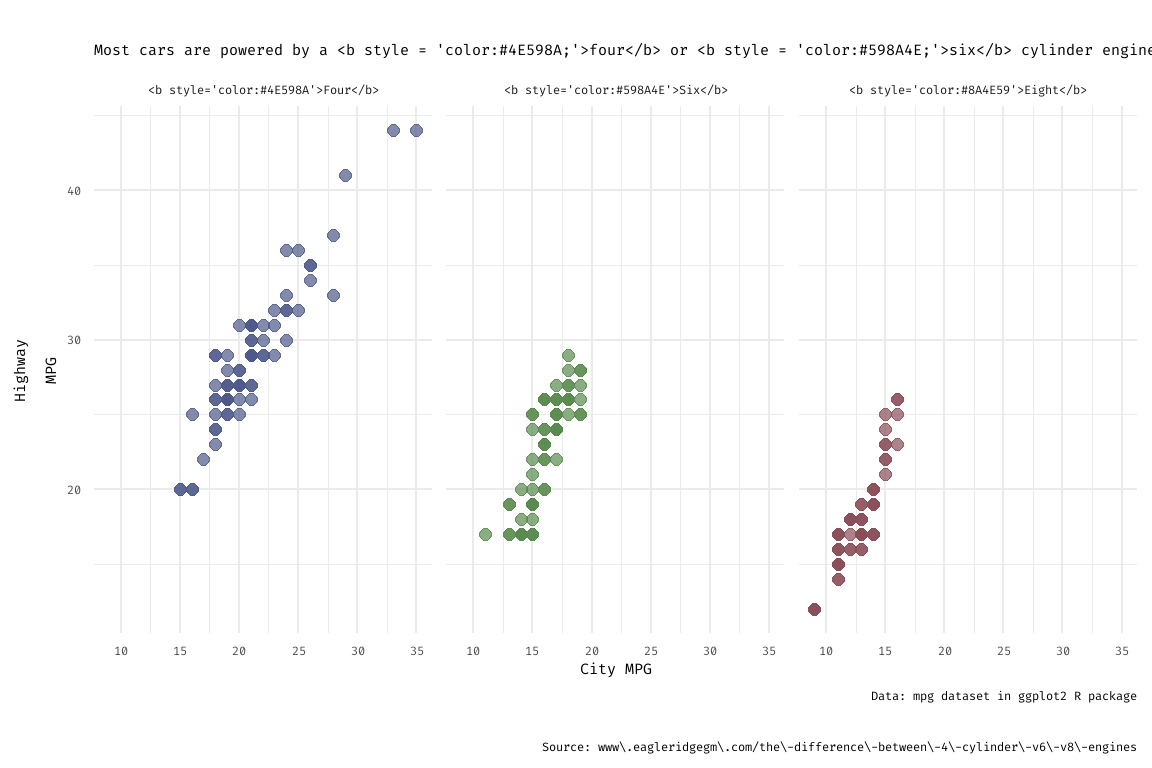
dat %>% ggplot() + geom_point(aes(x = cty, y = hwy, color = cyl_color), alpha = 0.7, size = 2) + scale_color_identity() + facet_wrap(~ cyl_text) + labs( title = title, subtitle = subtitle, x = 'City MPG', y = 'Highway\nMPG', caption = caption ) + theme_minimal() + theme(legend.position = 'none') + theme(text = element_text(family = 'Fira Code')) + theme(panel.grid = element_blank())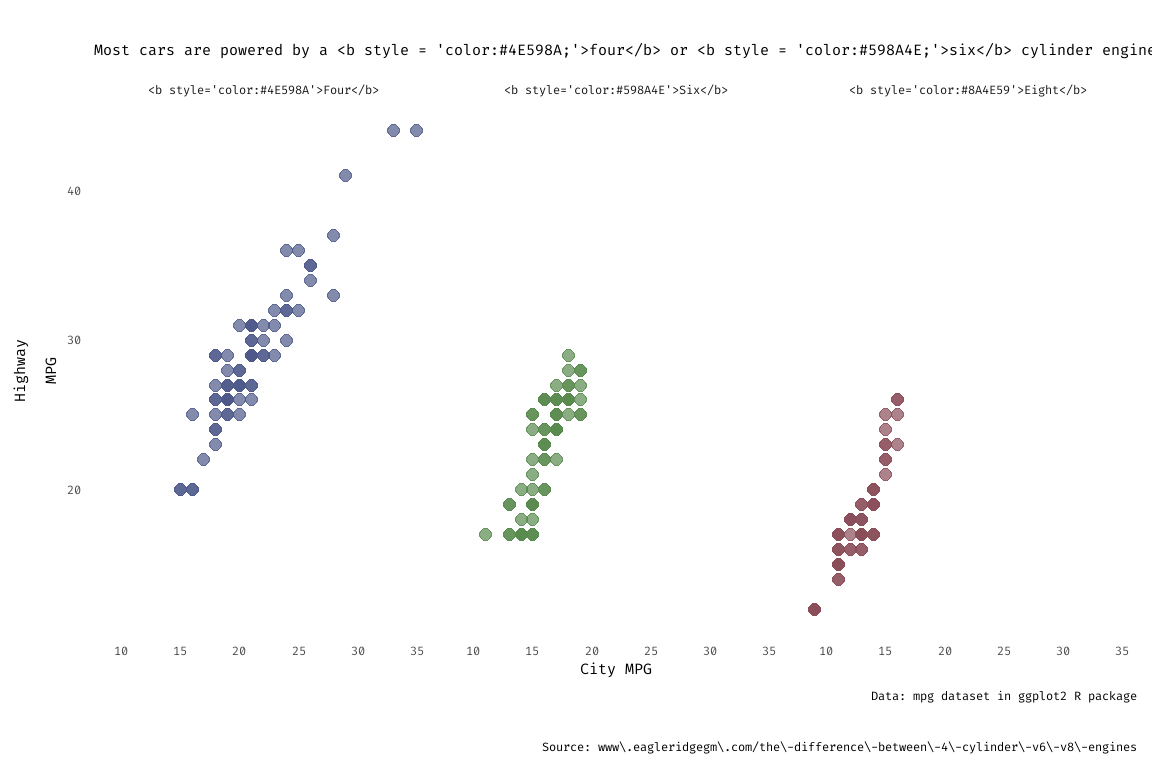
dat %>% ggplot() + geom_point(aes(x = cty, y = hwy, color = cyl_color), alpha = 0.7, size = 2) + scale_color_identity() + facet_wrap(~ cyl_text) + labs( title = title, subtitle = subtitle, x = 'City MPG', y = 'Highway\nMPG', caption = caption ) + theme_minimal() + theme(legend.position = 'none') + theme(text = element_text(family = 'Fira Code')) + theme(panel.grid = element_blank()) + theme(panel.spacing = unit(1, "lines"))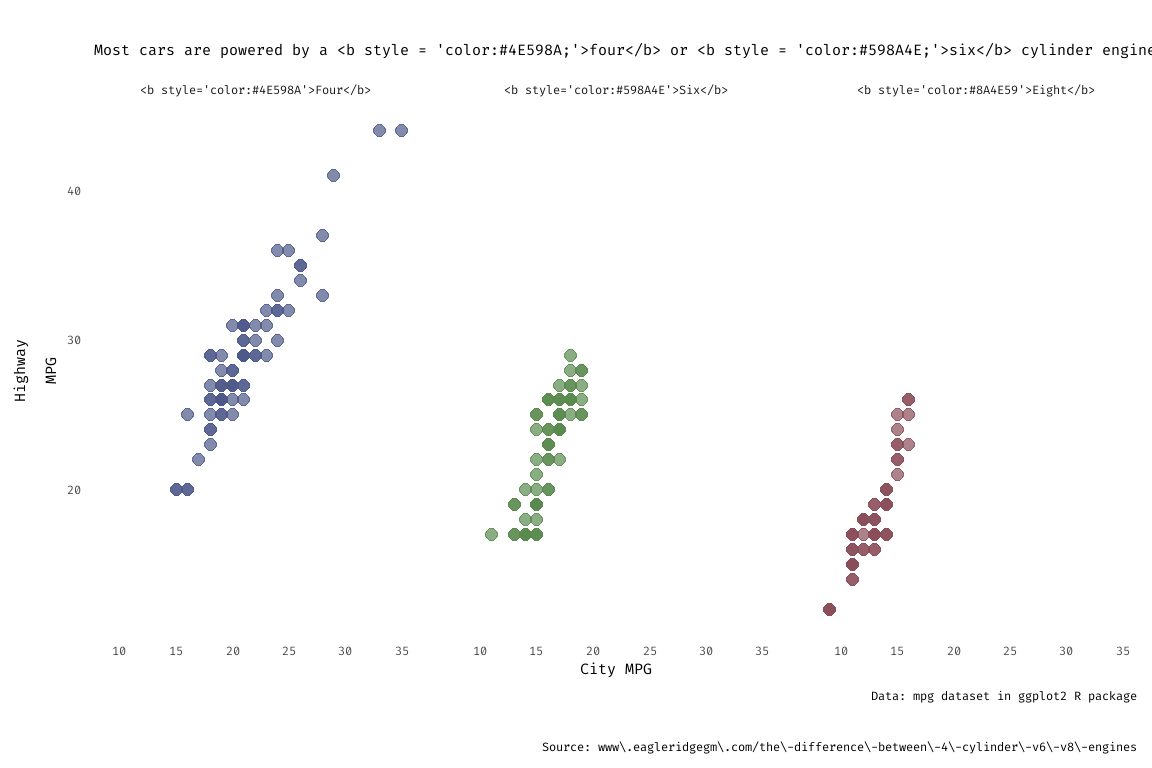
dat %>% ggplot() + geom_point(aes(x = cty, y = hwy, color = cyl_color), alpha = 0.7, size = 2) + scale_color_identity() + facet_wrap(~ cyl_text) + labs( title = title, subtitle = subtitle, x = 'City MPG', y = 'Highway\nMPG', caption = caption ) + theme_minimal() + theme(legend.position = 'none') + theme(text = element_text(family = 'Fira Code')) + theme(panel.grid = element_blank()) + theme(panel.spacing = unit(1, "lines")) + theme(plot.background = element_rect(fill = '#D3D3D3'))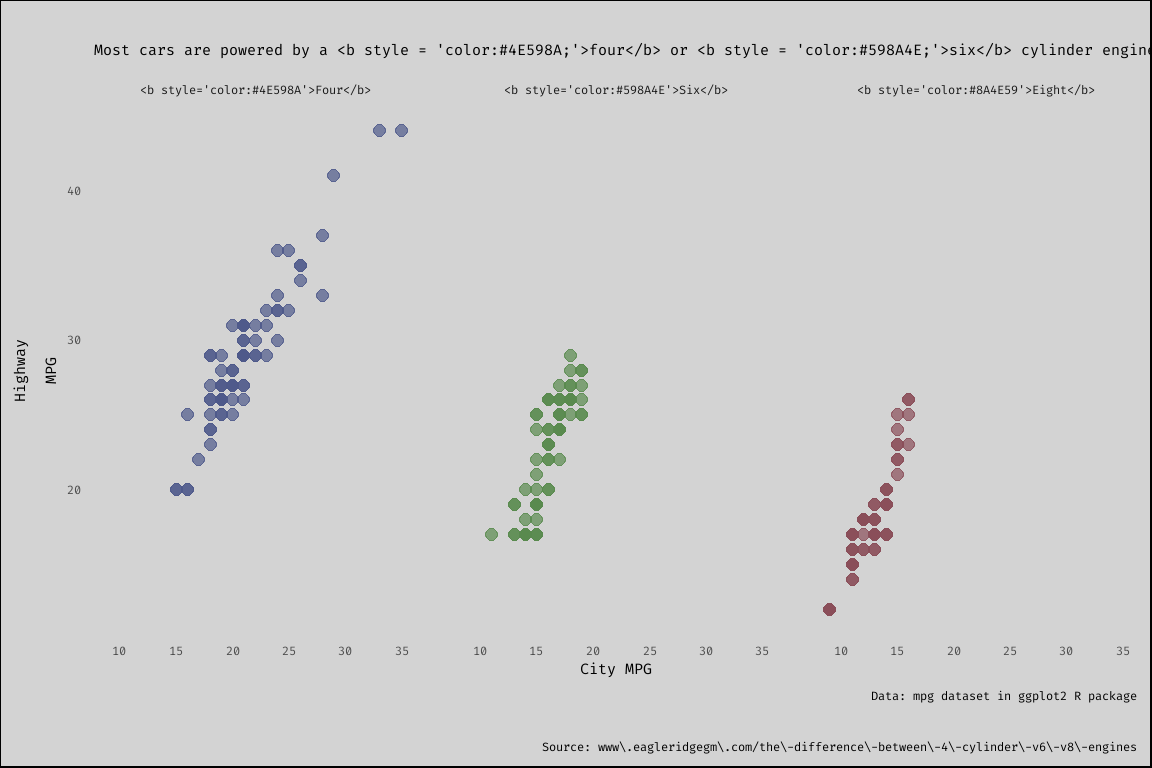
dat %>% ggplot() + geom_point(aes(x = cty, y = hwy, color = cyl_color), alpha = 0.7, size = 2) + scale_color_identity() + facet_wrap(~ cyl_text) + labs( title = title, subtitle = subtitle, x = 'City MPG', y = 'Highway\nMPG', caption = caption ) + theme_minimal() + theme(legend.position = 'none') + theme(text = element_text(family = 'Fira Code')) + theme(panel.grid = element_blank()) + theme(panel.spacing = unit(1, "lines")) + theme(plot.background = element_rect(fill = '#D3D3D3')) + theme(plot.margin = unit(c(.5,.75,.5,.75), 'cm'))
dat %>% ggplot() + geom_point(aes(x = cty, y = hwy, color = cyl_color), alpha = 0.7, size = 2) + scale_color_identity() + facet_wrap(~ cyl_text) + labs( title = title, subtitle = subtitle, x = 'City MPG', y = 'Highway\nMPG', caption = caption ) + theme_minimal() + theme(legend.position = 'none') + theme(text = element_text(family = 'Fira Code')) + theme(panel.grid = element_blank()) + theme(panel.spacing = unit(1, "lines")) + theme(plot.background = element_rect(fill = '#D3D3D3')) + theme(plot.margin = unit(c(.5,.75,.5,.75), 'cm')) + theme(plot.title.position = 'plot')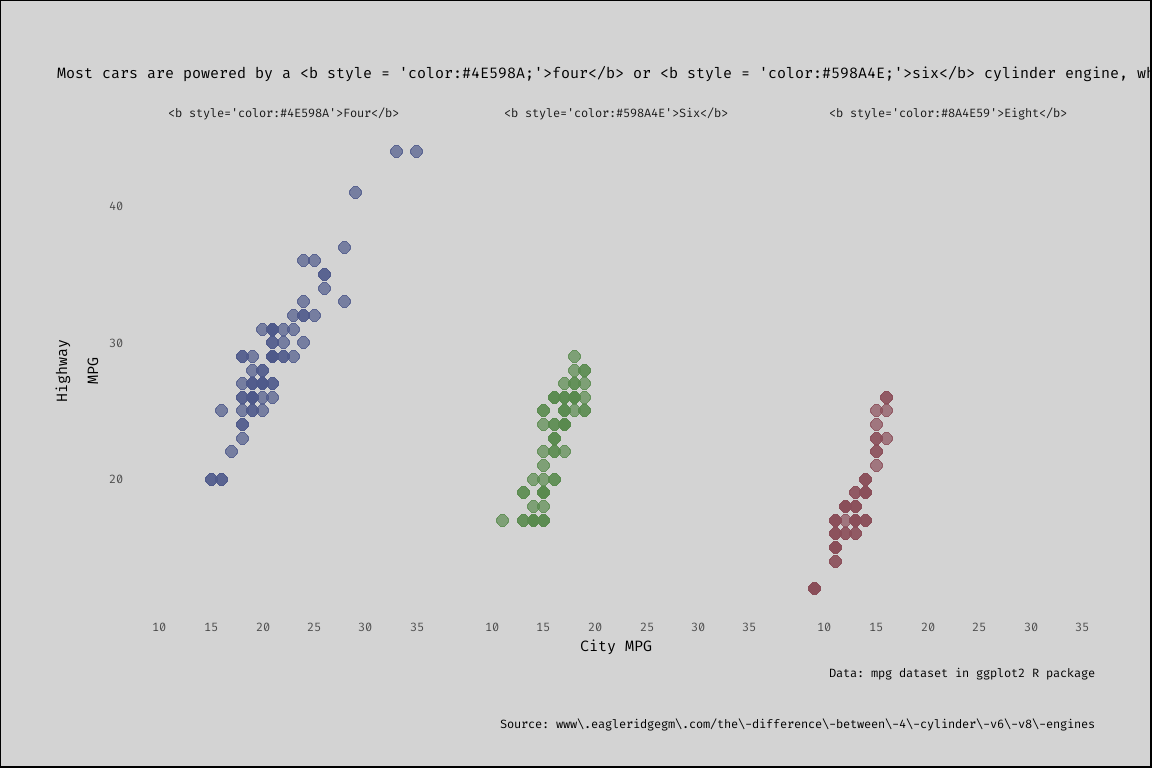
dat %>% ggplot() + geom_point(aes(x = cty, y = hwy, color = cyl_color), alpha = 0.7, size = 2) + scale_color_identity() + facet_wrap(~ cyl_text) + labs( title = title, subtitle = subtitle, x = 'City MPG', y = 'Highway\nMPG', caption = caption ) + theme_minimal() + theme(legend.position = 'none') + theme(text = element_text(family = 'Fira Code')) + theme(panel.grid = element_blank()) + theme(panel.spacing = unit(1, "lines")) + theme(plot.background = element_rect(fill = '#D3D3D3')) + theme(plot.margin = unit(c(.5,.75,.5,.75), 'cm')) + theme(plot.title.position = 'plot') + theme(plot.title = element_markdown(size = 16, face = 'bold', color = '#525252', lineheight = 1.2))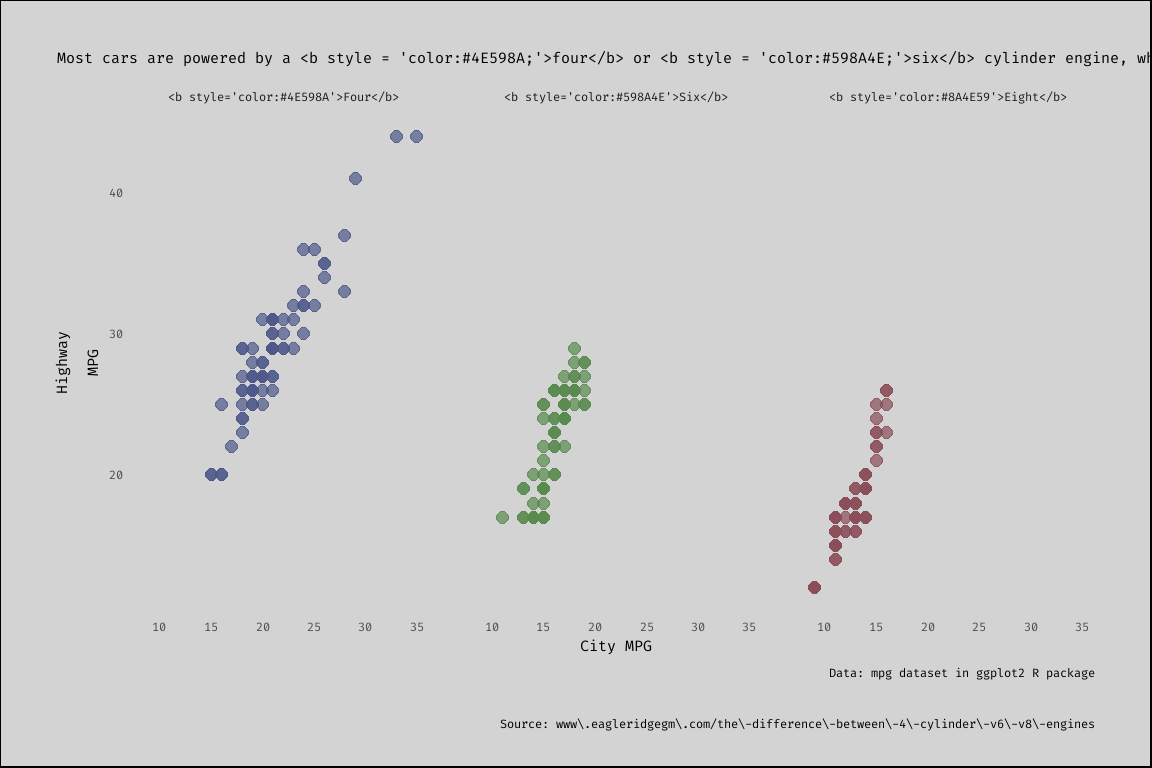
dat %>% ggplot() + geom_point(aes(x = cty, y = hwy, color = cyl_color), alpha = 0.7, size = 2) + scale_color_identity() + facet_wrap(~ cyl_text) + labs( title = title, subtitle = subtitle, x = 'City MPG', y = 'Highway\nMPG', caption = caption ) + theme_minimal() + theme(legend.position = 'none') + theme(text = element_text(family = 'Fira Code')) + theme(panel.grid = element_blank()) + theme(panel.spacing = unit(1, "lines")) + theme(plot.background = element_rect(fill = '#D3D3D3')) + theme(plot.margin = unit(c(.5,.75,.5,.75), 'cm')) + theme(plot.title.position = 'plot') + theme(plot.title = element_markdown(size = 16, face = 'bold', color = '#525252', lineheight = 1.2)) + theme(plot.subtitle = element_textbox_simple( size = 10, lineheight = 1.2, padding = margin(5.5, 5.5, 5.5, 5.5), margin = margin(0, 0, 5.5, 0), fill = '#CCCCCC'))
dat %>% ggplot() + geom_point(aes(x = cty, y = hwy, color = cyl_color), alpha = 0.7, size = 2) + scale_color_identity() + facet_wrap(~ cyl_text) + labs( title = title, subtitle = subtitle, x = 'City MPG', y = 'Highway\nMPG', caption = caption ) + theme_minimal() + theme(legend.position = 'none') + theme(text = element_text(family = 'Fira Code')) + theme(panel.grid = element_blank()) + theme(panel.spacing = unit(1, "lines")) + theme(plot.background = element_rect(fill = '#D3D3D3')) + theme(plot.margin = unit(c(.5,.75,.5,.75), 'cm')) + theme(plot.title.position = 'plot') + theme(plot.title = element_markdown(size = 16, face = 'bold', color = '#525252', lineheight = 1.2)) + theme(plot.subtitle = element_textbox_simple( size = 10, lineheight = 1.2, padding = margin(5.5, 5.5, 5.5, 5.5), margin = margin(0, 0, 5.5, 0), fill = '#CCCCCC')) + theme(plot.caption = element_textbox_simple( size = 9, lineheight = 1.2, margin = margin(20, 50, 0, 0), fill = '#D3D3D3'))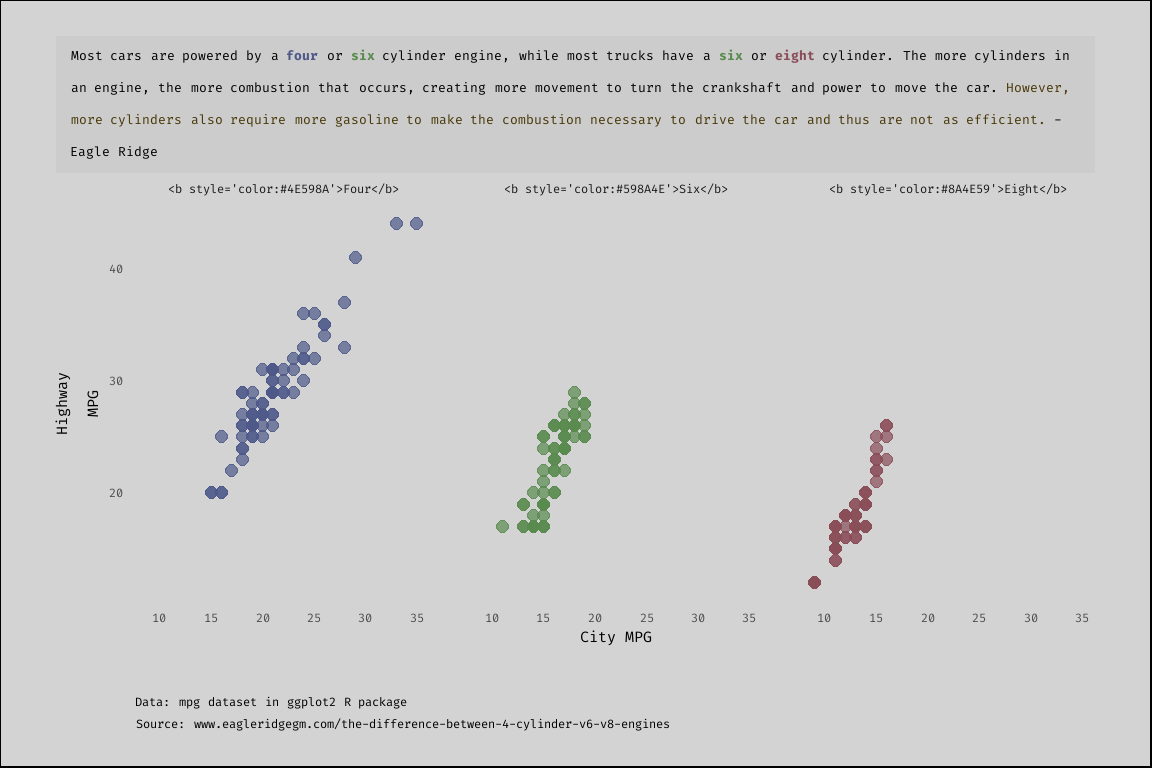
dat %>% ggplot() + geom_point(aes(x = cty, y = hwy, color = cyl_color), alpha = 0.7, size = 2) + scale_color_identity() + facet_wrap(~ cyl_text) + labs( title = title, subtitle = subtitle, x = 'City MPG', y = 'Highway\nMPG', caption = caption ) + theme_minimal() + theme(legend.position = 'none') + theme(text = element_text(family = 'Fira Code')) + theme(panel.grid = element_blank()) + theme(panel.spacing = unit(1, "lines")) + theme(plot.background = element_rect(fill = '#D3D3D3')) + theme(plot.margin = unit(c(.5,.75,.5,.75), 'cm')) + theme(plot.title.position = 'plot') + theme(plot.title = element_markdown(size = 16, face = 'bold', color = '#525252', lineheight = 1.2)) + theme(plot.subtitle = element_textbox_simple( size = 10, lineheight = 1.2, padding = margin(5.5, 5.5, 5.5, 5.5), margin = margin(0, 0, 5.5, 0), fill = '#CCCCCC')) + theme(plot.caption = element_textbox_simple( size = 9, lineheight = 1.2, margin = margin(20, 50, 0, 0), fill = '#D3D3D3')) + theme(axis.text = element_text(size = 12))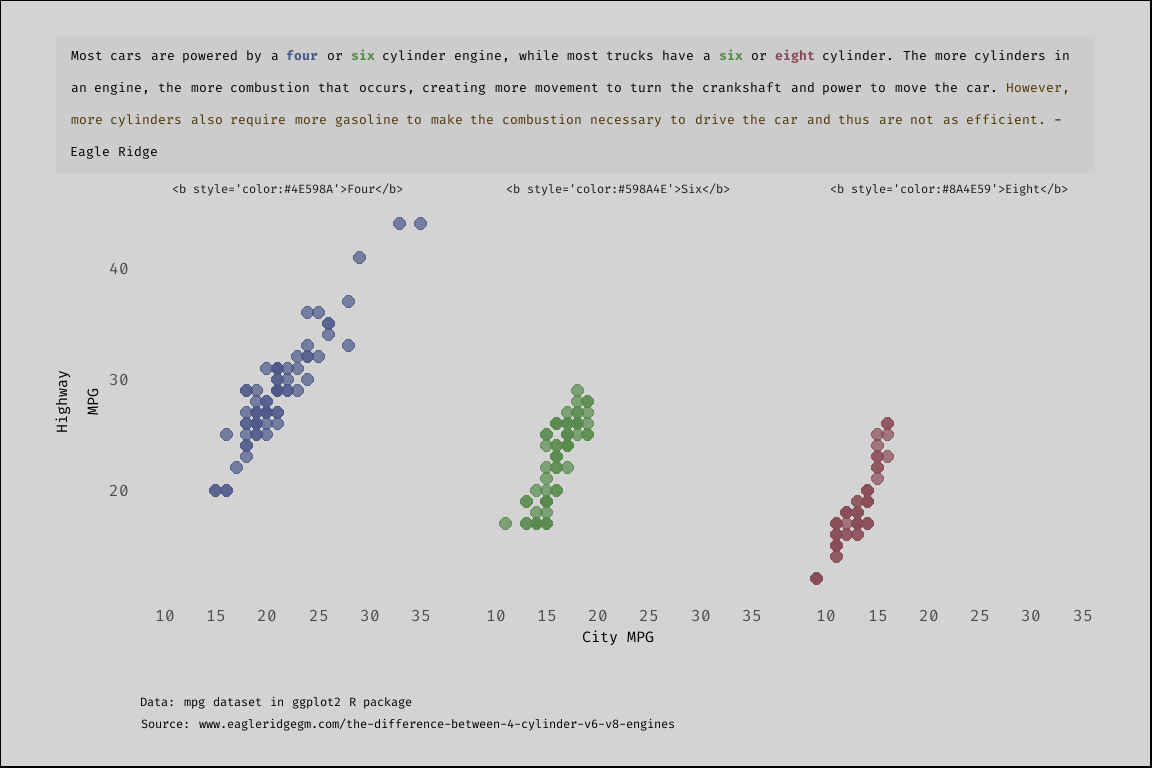
dat %>% ggplot() + geom_point(aes(x = cty, y = hwy, color = cyl_color), alpha = 0.7, size = 2) + scale_color_identity() + facet_wrap(~ cyl_text) + labs( title = title, subtitle = subtitle, x = 'City MPG', y = 'Highway\nMPG', caption = caption ) + theme_minimal() + theme(legend.position = 'none') + theme(text = element_text(family = 'Fira Code')) + theme(panel.grid = element_blank()) + theme(panel.spacing = unit(1, "lines")) + theme(plot.background = element_rect(fill = '#D3D3D3')) + theme(plot.margin = unit(c(.5,.75,.5,.75), 'cm')) + theme(plot.title.position = 'plot') + theme(plot.title = element_markdown(size = 16, face = 'bold', color = '#525252', lineheight = 1.2)) + theme(plot.subtitle = element_textbox_simple( size = 10, lineheight = 1.2, padding = margin(5.5, 5.5, 5.5, 5.5), margin = margin(0, 0, 5.5, 0), fill = '#CCCCCC')) + theme(plot.caption = element_textbox_simple( size = 9, lineheight = 1.2, margin = margin(20, 50, 0, 0), fill = '#D3D3D3')) + theme(axis.text = element_text(size = 12)) + theme(axis.title = element_text(size = 12, face = 'bold', color = '#525252'))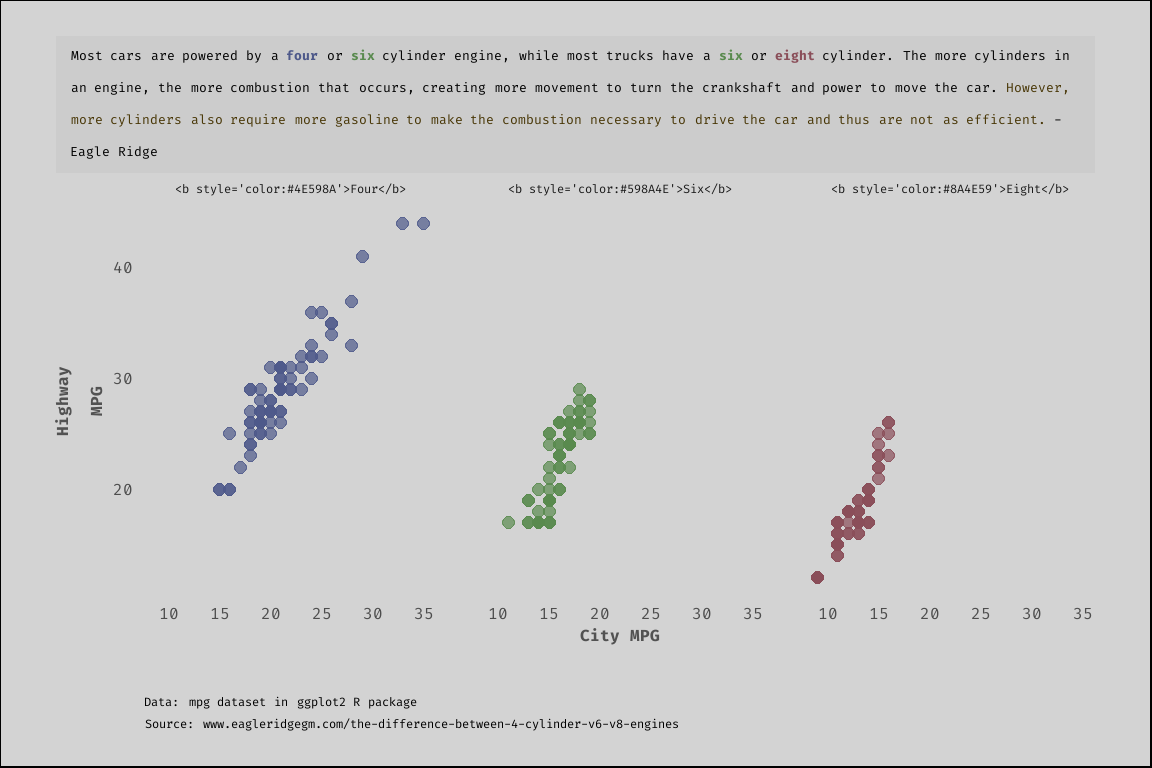
dat %>% ggplot() + geom_point(aes(x = cty, y = hwy, color = cyl_color), alpha = 0.7, size = 2) + scale_color_identity() + facet_wrap(~ cyl_text) + labs( title = title, subtitle = subtitle, x = 'City MPG', y = 'Highway\nMPG', caption = caption ) + theme_minimal() + theme(legend.position = 'none') + theme(text = element_text(family = 'Fira Code')) + theme(panel.grid = element_blank()) + theme(panel.spacing = unit(1, "lines")) + theme(plot.background = element_rect(fill = '#D3D3D3')) + theme(plot.margin = unit(c(.5,.75,.5,.75), 'cm')) + theme(plot.title.position = 'plot') + theme(plot.title = element_markdown(size = 16, face = 'bold', color = '#525252', lineheight = 1.2)) + theme(plot.subtitle = element_textbox_simple( size = 10, lineheight = 1.2, padding = margin(5.5, 5.5, 5.5, 5.5), margin = margin(0, 0, 5.5, 0), fill = '#CCCCCC')) + theme(plot.caption = element_textbox_simple( size = 9, lineheight = 1.2, margin = margin(20, 50, 0, 0), fill = '#D3D3D3')) + theme(axis.text = element_text(size = 12)) + theme(axis.title = element_text(size = 12, face = 'bold', color = '#525252')) + theme(axis.title.x = element_text(margin = unit(c(.5, 0, 0, 0), "cm")))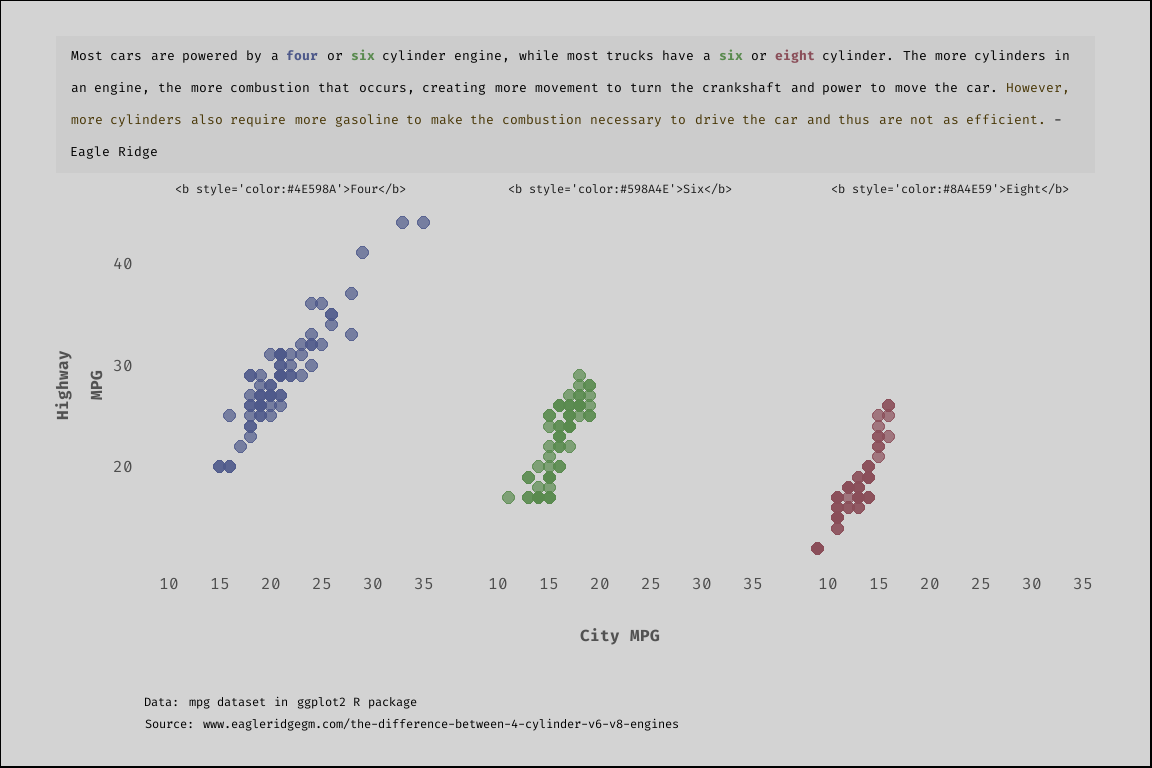
dat %>% ggplot() + geom_point(aes(x = cty, y = hwy, color = cyl_color), alpha = 0.7, size = 2) + scale_color_identity() + facet_wrap(~ cyl_text) + labs( title = title, subtitle = subtitle, x = 'City MPG', y = 'Highway\nMPG', caption = caption ) + theme_minimal() + theme(legend.position = 'none') + theme(text = element_text(family = 'Fira Code')) + theme(panel.grid = element_blank()) + theme(panel.spacing = unit(1, "lines")) + theme(plot.background = element_rect(fill = '#D3D3D3')) + theme(plot.margin = unit(c(.5,.75,.5,.75), 'cm')) + theme(plot.title.position = 'plot') + theme(plot.title = element_markdown(size = 16, face = 'bold', color = '#525252', lineheight = 1.2)) + theme(plot.subtitle = element_textbox_simple( size = 10, lineheight = 1.2, padding = margin(5.5, 5.5, 5.5, 5.5), margin = margin(0, 0, 5.5, 0), fill = '#CCCCCC')) + theme(plot.caption = element_textbox_simple( size = 9, lineheight = 1.2, margin = margin(20, 50, 0, 0), fill = '#D3D3D3')) + theme(axis.text = element_text(size = 12)) + theme(axis.title = element_text(size = 12, face = 'bold', color = '#525252')) + theme(axis.title.x = element_text(margin = unit(c(.5, 0, 0, 0), "cm"))) + theme(axis.title.y = element_text(angle = 0, vjust = 1))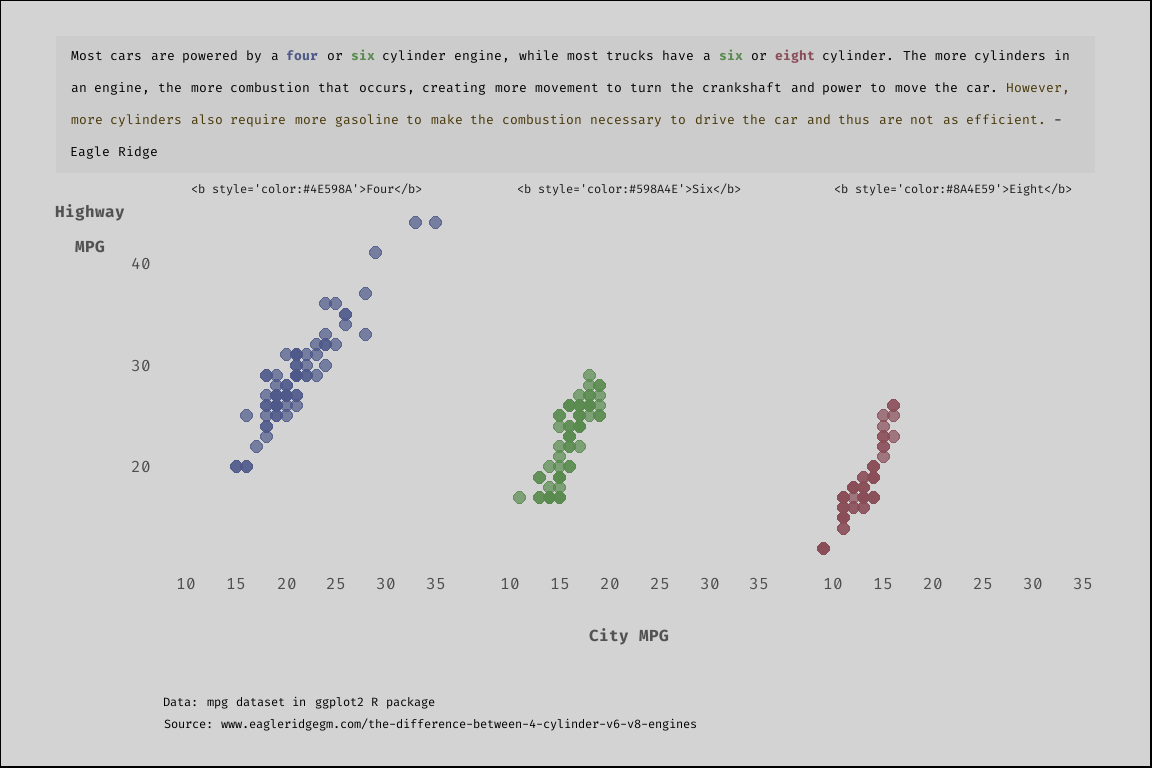
dat %>% ggplot() + geom_point(aes(x = cty, y = hwy, color = cyl_color), alpha = 0.7, size = 2) + scale_color_identity() + facet_wrap(~ cyl_text) + labs( title = title, subtitle = subtitle, x = 'City MPG', y = 'Highway\nMPG', caption = caption ) + theme_minimal() + theme(legend.position = 'none') + theme(text = element_text(family = 'Fira Code')) + theme(panel.grid = element_blank()) + theme(panel.spacing = unit(1, "lines")) + theme(plot.background = element_rect(fill = '#D3D3D3')) + theme(plot.margin = unit(c(.5,.75,.5,.75), 'cm')) + theme(plot.title.position = 'plot') + theme(plot.title = element_markdown(size = 16, face = 'bold', color = '#525252', lineheight = 1.2)) + theme(plot.subtitle = element_textbox_simple( size = 10, lineheight = 1.2, padding = margin(5.5, 5.5, 5.5, 5.5), margin = margin(0, 0, 5.5, 0), fill = '#CCCCCC')) + theme(plot.caption = element_textbox_simple( size = 9, lineheight = 1.2, margin = margin(20, 50, 0, 0), fill = '#D3D3D3')) + theme(axis.text = element_text(size = 12)) + theme(axis.title = element_text(size = 12, face = 'bold', color = '#525252')) + theme(axis.title.x = element_text(margin = unit(c(.5, 0, 0, 0), "cm"))) + theme(axis.title.y = element_text(angle = 0, vjust = 1)) + theme(strip.text = element_markdown(size = 14))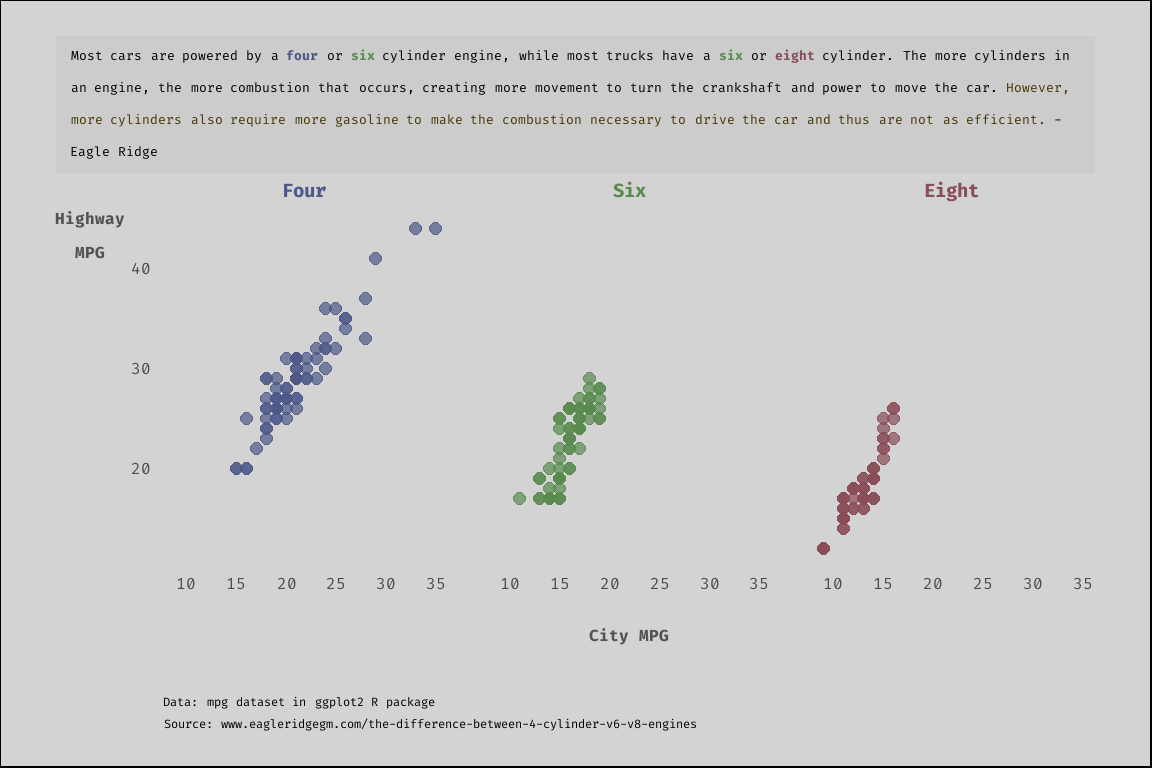
```{.r .distill-force-highlighting-css}
<style type="text/css">.remark-code{line-height: 1.5; font-size: 120%}@media print { .has-continuation { display: block; }}code.r.hljs.remark-code{ position: relative; overflow-x: hidden;}code.r.hljs.remark-code:hover{ overflow-x:visible; width: 500px; border-style: solid;}</style>```{.r .distill-force-highlighting-css}